|
We can help you with your SPSS projects or SPSS homework assignment, at any level! Get professional graphs, tables, syntax, and fully completed SPSS projects, with meaningful interpretations and write ups, in APA or any format you prefer. Whether it is for a Statistics class, Business Stats class, a Thesis or Dissertation, you'll find what you are looking for with us Our service is convenient and confidential. You will get excellent quality SPSS help for you. Our rate starts at $35/hour. Free quote in hours. Quick turnaround! |
Help with SPSS Statistical Data Analysis
SPSS is one the leading statistical software in the world. It provides powerful data analysis tools, which are indispensable for professionals in many different areas. SPSS is required at many universities, and it is for most part the standard for data analysis in several fields.
We offer professional assistance in several topics. We have assisted hundred of clients with their homework, dissertation, etc.
Submit your SPSS projects to us for a free quote and we will be back shortly with a estimate of the cost. It costs you NOTHING to find out how much it would be to solve your problems. See a sample of our work.
|
|
This is a list of statistical procedures for SPSS that you may be interested in:
- Survey Analysis
- Design of surveys
- Reports - Crosstabs
- Scales - Reliability - Cronbach's Alpha
- Factor Analysis - Principal Components
- Validity
- Questionnaire Analysis using SPSS
- Discriminant Analysis
- Data Analysis, Sampling and Charts
- Sampling Methods: Random, Stratified, Cluster, etc.
- Histograms
- Stem and Leaf
- Box-Plot
- Normality Tests (Anderson-Darling, Kolmogorov)
- Measures of Central Tendency and Dispersion
- Mean
- Standard Deviation
- Variance
- Standard Error of the Mean
- Range
- Skewness
- Coefficient of variation
- Regression Analysis
- Coefficient of Correlation
- Coefficient of Determination
- Least Squares Method
- Multiple Linear Regression
- Multivariate Statistical Analysis
- Logistic Regression in SPSS
- Times Series
- Control Charts
- Autocorrelation
- Seasonal Indexes
- Trends, cycles
- Forecasting
- Probability Distributions
- Binomial Distribution
- Poisson Distribution
- Exponential Distribution
- Standard Normal Distribution
- Hypothesis Testing
- Z-test, two independent samples
- t-test, two independent samples, paired samples
- F-test
- Non-parametric Chi Square test
- One Way and Two way ANOVA
- Factorial ANOVA
- ANCOVA and MANOVA in SPSS
- Levene's Test
- Crosstabs
- Chi Square Tests
- Non-Parametric Tests
With our help, you'll get that extra edge you need! Don't hesitate contact us and we'll provide you with professional SPSS help. Either for simple problems or for dissertation help with SPSS, we can assist you providing you an accurate and clear interpretation of those SPSS outputs. The information we provide will give you hints on how to learn SPSS
Why we can help with your SPSS projects?
Year of Experience
We have been online for more than 10 years, we have worked with thousands of customers who have been able to appreciate the quality of our work
SPSS Expertise
SPSS is a software package that demands technical knowledge of both the software itself and the technical statistical aspects involved in the procedures. Our tutors are the right experts to help you with your homework or anything academic related with SPSS projects or assignments
Step-by-Step Solutions
Our tutors provide detailed, step-by-step solutions, and we put a lot of care in double checking our calculations
Free Quote
You can e-mail us your problems 24x7. We will send a free quote ASAP
Very Competitive Prices
We try to accommodate to all budgets. No job is too big or too small with us. We make our best to accommodate to our customers' needs
We take pride of our work
We do our work with care. We are experts and we take pride in what we do. Our main objective is our customers' complete satisfaction. We take great care in paying attention to all the requirements and details, with the purpose of fulfilling work of the highest quality
and more...
SAMPLE SPSS WORK
Problem 1:
Analyze the data using the methods of this chapter (ANOVA).
· Based on the results, does it appear that there is sufficient evidence to support the claim that the drug lowers pulse rate?
· Are there any serious problems with the design of the experiment?
· Given that only males were involved in the experiment do the results also apply to females?
· The project manager compared the post treatment pulse rates to the mean pulse rate for adult males. Is there a better way to measure the drug’s effectiveness in lowering pulse rates?
· How would you characterize the overall validity of the experiment?
· Based on the available results, should the drug be approved?
· Write a brief report summarizing your findings.
|
Placebo Group |
10-mg Treatment Group |
20-mg Treatment Group |
|
77 |
67 |
72 |
|
61 |
48 |
94 |
|
66 |
79 |
57 |
|
63 |
67 |
63 |
|
81 |
57 |
69 |
|
75 |
71 |
59 |
|
66 |
66 |
64 |
|
79 |
85 |
82 |
|
66 |
75 |
34 |
|
75 |
77 |
76 |
|
48 |
57 |
59 |
|
70 |
45 |
53 |
Solution: (a) We need to test the following hypotheses:
\[\begin{align} & {{H}_{0}}:{{\mu }_{P}}={{\mu }_{10Mg}}={{\mu }_{20\,Mg}} \\ & {{H}_{A}}:\text{Not all the means are equal} \\ \end{align}\]
We perform an ANOVA analysis with the aid of SPSS. The results are shown below:
The ANOVA table shows that the F-statistics is F = 0.287, and the p-value is p = 0.752, which is greater than the significance level 0.05, which means that we fail to reject the null hypothesis of equal variances. This means that we don’t have enough evidence to claim that the means are not the same, at the 0.05 significance level.
(b) The design doesn't seem to have any serious problem, other than it was applied only to men. If the test was meant to be valid for both men and women, then the design is flawed.
In terms of the assumption for ANOVA, the homogeneity of variance is satisfied as shown in the following table:
The p-value of the test is p = 0.457, which means that we fail to reject the null hypothesis of equal variances.
(c) The results don’t apply to women, since only men participated in the experiment.
(d) For this type of experiment, it would have been convenient to add a four group with subject with normal pulse rates. Then, applying ANOVA we can determine if there is a significant difference between the groups. If there’s a significant difference, we can apply a Post Hoc test to determine with group has a different mean.
(e) If the goal of the experiment is to study the effect of the treatments on the pulse rate of men, the validity doesn’t seem to be seriously flawed. Nevertheless, if the purpose of the test is to assess the effect of the treatments on the pulse rate in general, the validity may be low.
(f) The drug shouldn’t be approved because it doesn’t seem to have a significant effect on the pulse. Besides, since the experiment had only male participants, the conclusions are biased towards one gender.
Problem 2: The VP of HR at the large software company in your region is concerned that the company is not doing enough to recognize generational differences with their employees. She is concerned that younger generations of employees are less satisfied than older generations and, what’s more, that the age-old strategy of paying employees more to increase their satisfaction isn’t working as well with the younger group.
You have been hired by the VP to dig deeper into these issues of generational differences, job satisfaction, and the satisfaction involved with higher income. Working with the dataset labeled “P 6_generational-job-sat”, analyze and interpret the main effects and interaction effects of generation (age category or ‘age_bin’, indicating this is a binary variable) and income (income category or ‘inccat’) on job satisfaction (‘jobsat’). (*Note: both independent variables are measured as categorical variables for all analysis purposes).
For full credit, your answer should include the following parts:
- Statement of what analysis you will use to analyze these data
- Acknowledgment of key assumptions of the analysis you use
- Statement of null and alternative hypotheses
- All test statistics and p-values relevant to hypotheses
- Conclusion in terms of hypotheses
- Graphical illustration of the interaction effect (whether or not it is significant)
- Complete interpretation of results (referring to all effects tested), put into the original context of the VP’s concern
Solution: For the sake of the analysis, we will use Job Satisfaction as an interval variable in spite of the fact that it is defined as an ordinal variable. With that assumption in mind, a Two-Way ANOVA will be performed with JobSat as the dependent variable and Age_bin and IncCat as the factors.
We are interested in testing
\[\begin{align}& {{H}_{0}}:\text{Income doesn }\!\!'\!\!\text{ t have an effect on Job Satisfaction} \\ & {{H}_{A}}:\text{Income has an effect on Job Satisfaction} \\ \end{align}\]
\[\begin{align}& {{H}_{0}}:\text{Age doesn }\!\!'\!\!\text{ t have an effect on Job Satisfaction} \\ & {{H}_{A}}:\text{Age has an effect on Job Satisfaction} \\ \end{align}\]
and\[\begin{align} & {{H}_{0}}:\text{ The interaction term is not significant} \\ & {{H}_{A}}:\text{ The interaction term is significant} \\ \end{align}\]
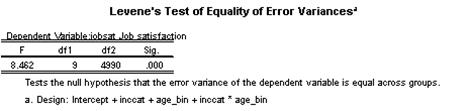
The assumption of homogeneity of variances is not met, p = 0.000.
The following ANOVA results are obtained:
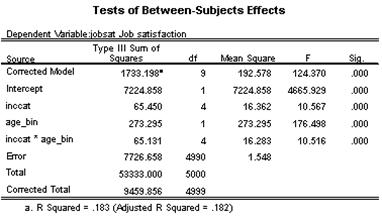
Notice that the interaction term is significant, F = 10.516, p =0.000. Also, the main effects are significant. In fact IncCat is significant (F = 10.657, p = 0.000) and Age_bin is also significant (F = 176.498, p = 0.000).
Graphically: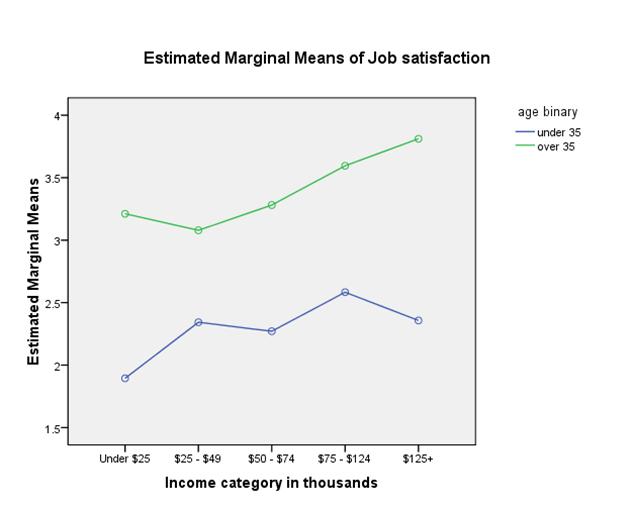
SPSS Blog
Using SPSS To Run Some Advanced Statistical Analyses: MANOVA and MANCOVA.
How to interpret SPSS cross-tabulations. Check this article out.
Learn how to conduct a reliability and principal components analysis with SPSS
Another case study of how to use SPSS for multiple regression analyses.
Do you know how to use SPSS for non-parametric tests? Check it out!.
Check out how to use SPSS to deal with a descriptive statistics problem.
SPSS can also be used to conduct correlational analysis. Learn more here.
Follow this Steps to conduct a paired-samples t-test with SPSS.
A fully worked example of using SPSS to run a logistic regression analysis.
SPSS can also help you with some easier procedures such as one-sample hypothesis tests.
One of the key assumptions in regression analysis to get valid results is independence of errors. Check out to deal with multicollinearity in SPSS.
One of the most common basic Stats analysis you can conduct with SPSS is a One-Way ANOVA with post-hoc analysis.
Do not go alone when you need conduct some SPSS analysis.
So I have a SPSS assignment that I am struggling with, where do I go from here
Why some many students have troubles with SPSS and what can be done about it
Can I find reliable SPSS help online?
Your options to find SPSS homework help, even with a presential or an online tutor.
Check out this multiple regression case study with SPSS.
Learn how to do regresion and ANOVA with SPSS.
Looking for Statistics Help with SPSS, look no further.
Learn how to conduct a Two-Way ANOVA analysis, with the aid of SPSS, step-by-step.
All the procedures for a linear regression analysis with SPSS.