STATA Help
|
Help with STATA Projects
STATA is one very sophisticated piece of software, not necessarily intended for the basic user. In spite of the fact that it has a very complete (even though not too friendly) graphical interface to access most of the statistical procedures, the real power of STATA consists of the ease of use of syntax commands that it has. But that power comes with the complication that you need to know very well what you're doing.
We offer professional assistance with most STATA procedures. We have assisted hundred of clients with their homeworks, dissertations, etc.
Submit your STATA projects to us for a free quote and we will be back shortly with a estimate of the cost. It costs you NOTHING to find out how much it would be to solve your problems. See a sample of our work.
This is a list of statistical procedures for STATA that you may be interested in:
- Survey Analysis
- Design of surveys
- Reports - Crosstabs
- Scales - Reliability - Cronbach's Alpha
- Factor Analysis - Principal Components
- Validity
- Questionnaire Analysis using STATA
- Discriminant Analysis
- Data Analysis, Sampling and Charts
- Sampling Methods: Random, Stratified, Cluster, etc.
- Histograms
- Stem and Leaf
- Box-Plot
- Normality Tests (Anderson-Darling, Kolmogorov)
- Measures of Central Tendency and Dispersion
- Mean
- Standard Deviation
- Variance
- Standard Error of the Mean
- Range
- Skewness
- Coefficient of variation
- Regression Analysis
- Coefficient of Correlation
- Coefficient of Determination
- Least Squares Method
- Multiple Linear Regression
- Multivariate Statistical Analysis
- Logistic Regression in STATA
- Times Series
- Control Charts
- Autocorrelation
- Seasonal Indexes
- Trends, cycles
- Forecasting
- Probability Distributions
- Binomial Distribution
- Poisson Distribution
- Exponential Distribution
- Standard Normal Distribution
- Hypothesis Testing
- Z-test, two independent samples
- t-test, two independent samples, paired samples
- F-test
- Non-parametric Chi Square test
- One Way and Two way ANOVA
- Factorial ANOVA
- ANCOVA and MANOVA in STATA
- Levene's Test
- Crosstabs
- Chi Square Tests
- Non-Parametric Tests
STATA tends to be more complicated to grasp than other statistical softwares, for new users. And we can help you with that. Don't hesitate contact us and we'll provide you with professional STATA help. Either for simple problems or for dissertation help with STATA, we can assist you providing you an accurate and clear interpretation of those STATA outputs. The information we provide will give you hints on how to learn STATA
Why we can help with your STATA projects?
Year of Experience
We have been online for more than 10 years, we have worked with thousands of customers who have been able to appreciate the quality of our work
STATA Expertise
STATA is a software package that demands technical knowledge of both the software itself and the technical statistical aspects involved in the procedures. Our tutors are the right experts to help you with your homework or anything academic related with STATA projects or assignments
Step-by-Step Solutions
Our tutors provide detailed, step-by-step solutions, and we put a lot of care in double checking our calculations when required
Free Quote
You can e-mail us your problems 24x7. We will send a free quote ASAP
Very Competitive Prices
We try to accommodate to all budgets. No job is too big or too small with us. We make our best to accommodate to our customers' needs
We take pride of our work
We do our work with care. We are experts and we take pride in what we do. Our main objective is our customers' complete satisfaction. We take great care in paying attention to all the requirements and details, with the purpose of fulfilling work of the highest quality
and more...
SAMPLE STATA WORK
Question: Use gss2006_ chapter8.dta. Imagine that you heard somebody at the bar say that there was no reason to provide more educational opportunities for women because so many of them just stay at home anyway. Smack him. Then run some tests to see if there is any merit to this claim. Describe the variables educ and hrs 1. Do a correlation and regression of hour worked in the last week on years of education. Next, to separate analyses for men and women. Interpret the correlation and the slope for the overall sample, and then for women and men separately. Substantively, what does this say about women and education? Does this mean that, as that jerk in the bar said, we shouldn’t provide educational opportunities for women?
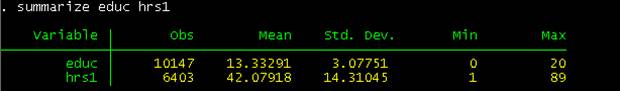
Solution: The following descriptive statistics are obtained:
Then, the following scatterplot is constructed:
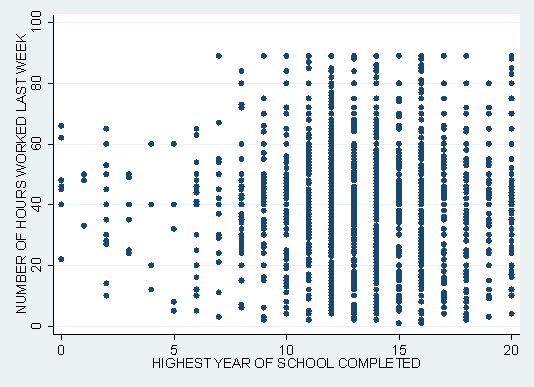
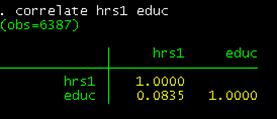
The graph above suggests that there is not a significant association between EDUC and HRS. The following regression results are obtained:
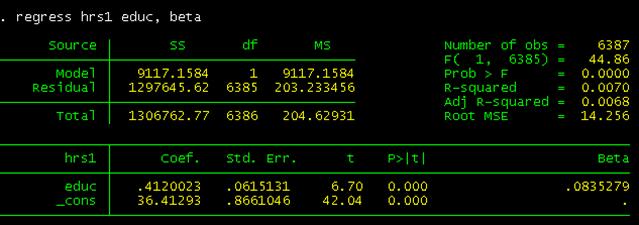
The regression model is significant, F(1, 6385) = 44.86, p < .001. But the amount of explained variation is 0.7%, which is extremely small. This indicates that even though the association is significant, it is not of practical significance. The model is
HRS1 = 36.41293 + 0.4120023*EDUC
Now we do it by gender
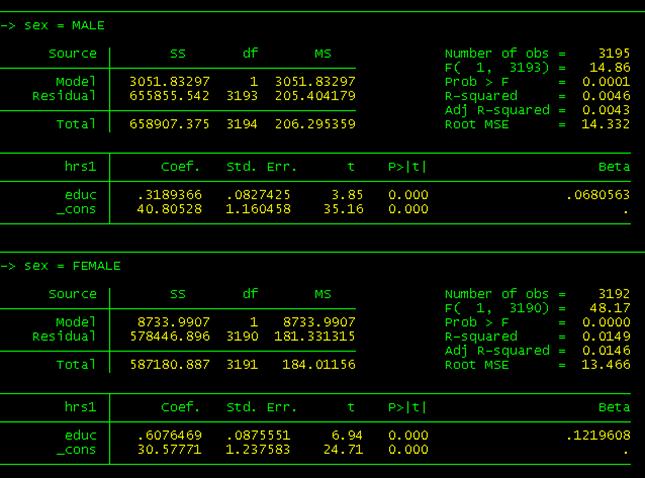
Both of the linear regression models is significant, for males and females, but still, the amount of explained variation in HRS1 is extremely low in both cases (0.46% and 1.49% respectively).
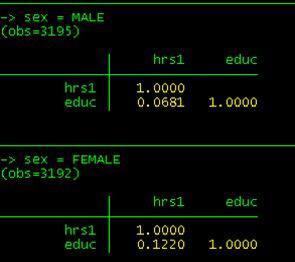
The correlation for males is r = 0.0681, whereas the correlation for females is r = 0.1220. For males, an extra year of education brings extra 0.3189 hours of work, on average, whereas, for females, an extra year of education brings extra 0.6076 hours of work, on average.