SPSS Homework Help: Tips you can use
There is nothing that can be more despairing than having to complete a SPSS homework assignment using a software that we don't know to use, and you need help with.
I mean, like anything that is computer-based, there will be a learning curve, and using SPSS is no exception.
|
We can provide you with the SPSS Help you need, at any level!
Get professional graphs, tables, syntax, and fully completed SPSS projects, with meaningful interpretations and write up, in APA or any format you prefer. Whether it is for a Statistics class, Business Stats class, a Thesis or Dissertation, you'll find what you are looking for with us Our service is convenient and confidential. You will get excellent quality SPSS help for you. Our rate starts at $35/hour. Free quote in hours. Quick turnaround! |
Things will likely look easy after a while, but starting with SPSS can be daunting, especially if you are not particularly versed in computers. But fear not because we can help with your SPSS assignment.
You will need to learn how to type the data in, you will need to learn how to navigate the menus. On top of that, you need to learn how to interpret the menus.
How to Get Started
The first thing to do is to input the data. Maybe some people will say that is incorrect, because the first thing should be to tinker with the setting to enhance the format of the pivot tables, etc.
But we are thinking about more basic stuff here: You want to know how to conduct your first SPSS analysis, and tinkering with advanced settings is not what you really are concerned about.
The first window you will see is the variable view window:
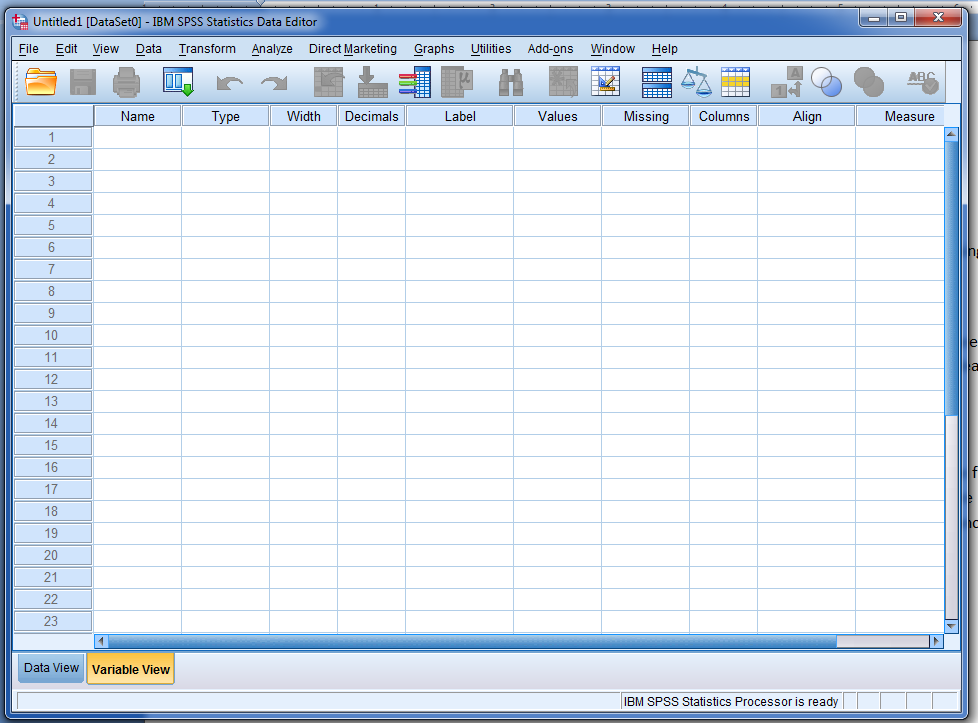
At this point, the way to define the variables requires a bit of understanding of how SPSS works. The best way to see it is to do it via an example: Say that your homework problem says to compare systolic blood pressure (SBP) for men and women.
Then you will want to define two variables: SBP and Gender. SBP is an interval variable and it will be our dependent variable, whereas Gender is a nominal variable with two categories, Male and Female.
This is one point where things may go confusing for stats students, which is, how do I represent the values for the Gender variable. There is not only one way to do it. For the sake of convenience we will assign the values 1 = Male and 2 = Female. Now the variable looks like this:
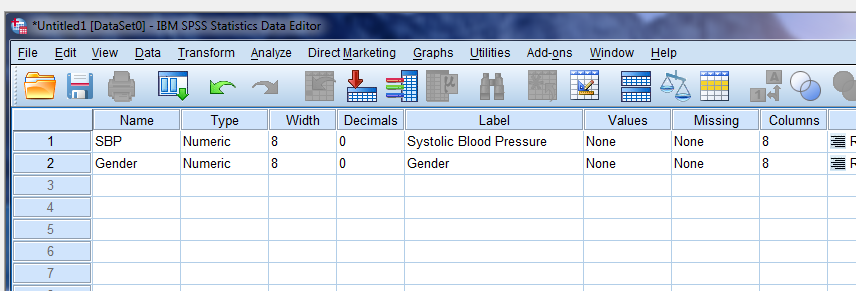
In order to define the possible values for the nominal variable Gender, we need to click on the "Values" cell and do the following:
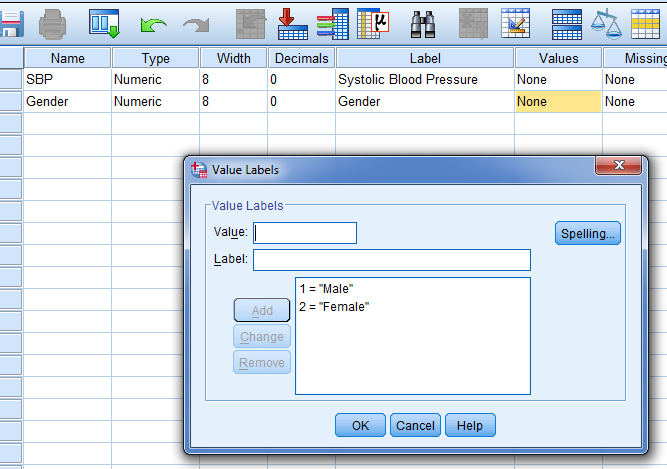
And then click "OK".
Typing the Data In
Once you have defined the variables, you need to now go to the "Data View" tab, to input the data. In this example, assume that we have a sample of 10 men and 10 women. The data may look something like this:
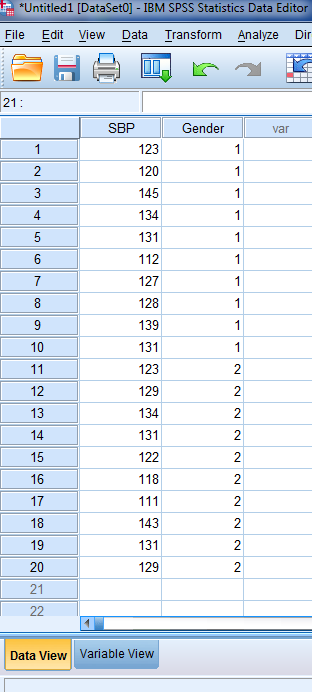
Observe how the first 10 rows have the value of "1" for Gender, which represents the systolic pressure data for men. SPSS understand that every time you type "1" in the Gender column, you mean that the person is a man, and when you type "2", you mean that the person is woman.
So those are the basics of typing data in to SPSS. Depending of the type of problems you have in your SPSS homework assignment, you may have to type the data in, pretty much the way I just did above.
Or you may be provided with a ready-made SPSS dataset, in which case you may need to do nothing, or you may need to do some recoding or clean up of values. There is actually a LOT to managing data in SPSS, that go beyond the scope of this brief tutorial.
SPSS Data Analysis Results
So after the data is ready to rock and roll, it is time for the fun. It is safe to say that the more tedious part of SPSS is data handling, in which you need to take care of missing data, recode, fix labels, construct (compute) new variables etc.
Like I mentioned before, there is a lot to SPSS data management and you may need expert help if you are not too knowledgeable of the SPSS capabilities.
But say you are there, you have your data together, it is all clean, all values and labels are fine, you have dealt with missing data, outliers, data transformation and all data.
Then you have to run the tests. In this concrete example, we are interested in assessing whether not there is a significant difference in systolic blood pressure between males and females. Therefore, the appropriate test to use is a t-test for two independent samples.
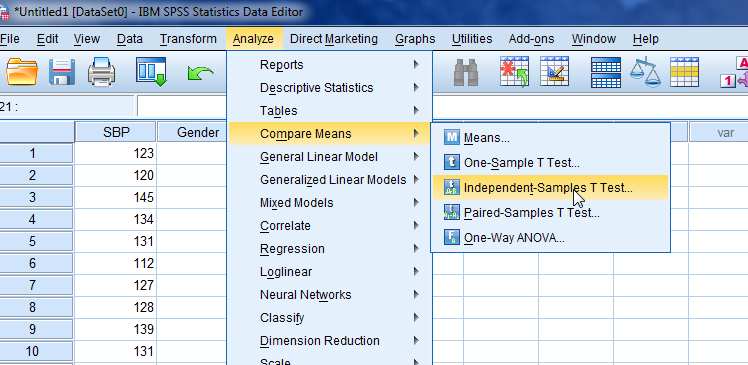
Here is where you need to navigate through the GUI and the menus that SPSS has to offer. Depending on your version, the sequence of menus is Analyze > Compare Means > Independent-Samples T-test. Then you will be presented with the following:
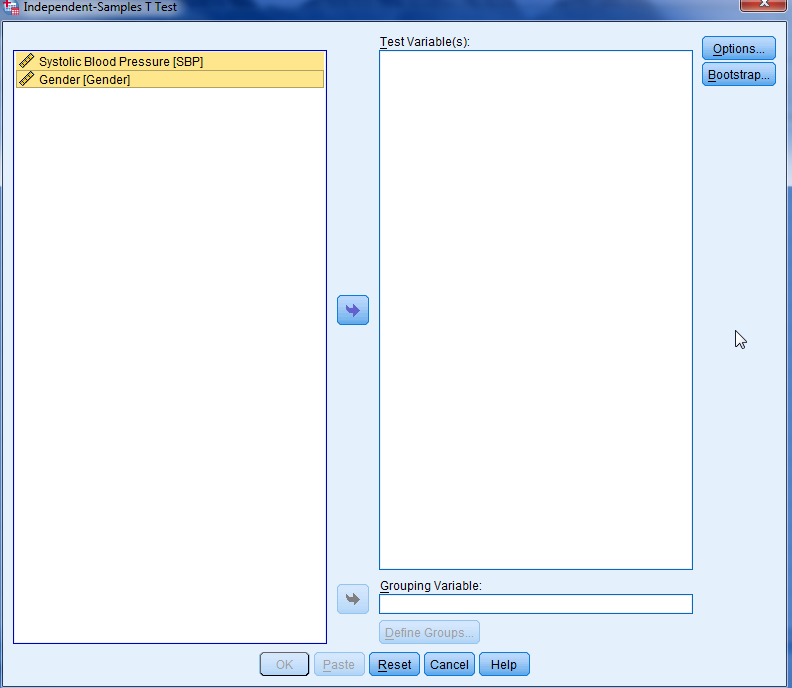
You need to pass the variable SBP to the "Test Variables" window, and the Gender to the "Grouping Variable" box. There is one more thing that needs to be done. You need to click on "Define groups", and when the windows pop up, you type "1" in Group 1, and type "2" in Group 2, to let SPSS know that you want to have the independent variable to consider your two possible values: 1 = Man, 2 = Woman.
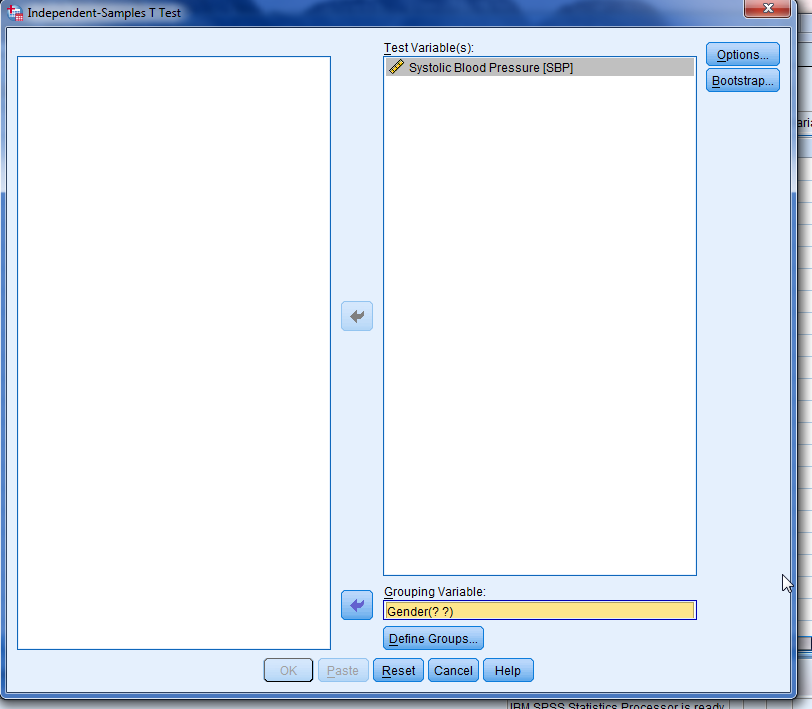
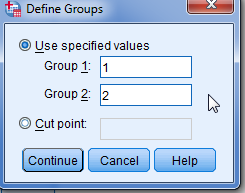
Then click "Continue". After that we are almost ready. You will still have the chance to review the Options, but normally there is nothing else to do in the simplest possible case. Then you click "OK" and SPSS will render the results for you in a new output window. An example is shown below:
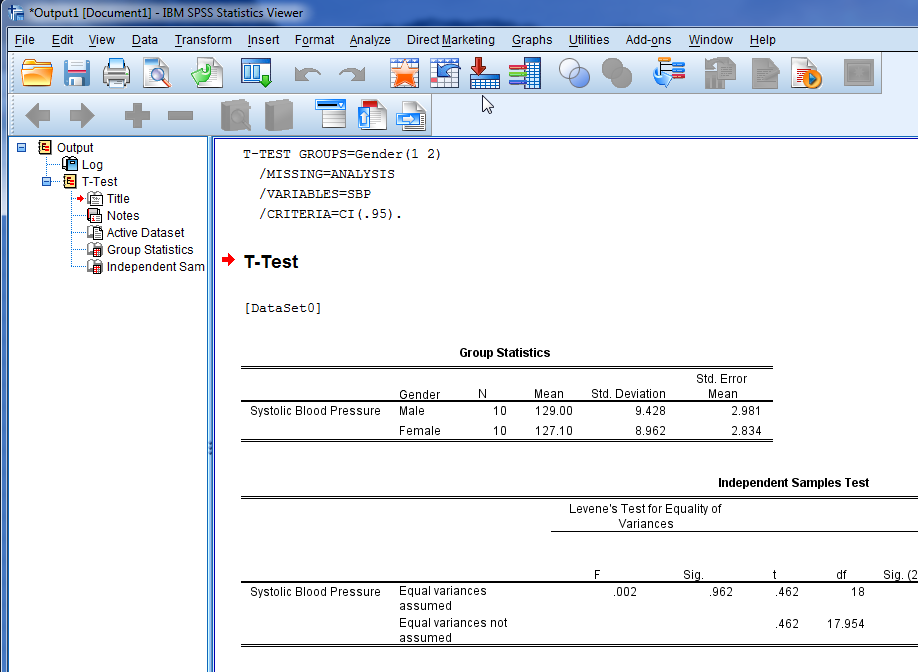
And now finally you can have fun, and use all this information provided by SPSS to write up your report, based on the formatting requirements provided by your instructor.
Final Thoughts
Working on a SPSS assignment does have a learning curve, but after a while it will get easier. In the end, may people think that inputting data and navigating through the menus is the hard part of the process, but in reality, the hardest part is to interpret the data.
Maybe not so much in the case of a simple t-tests, but in case of more advanced statistical procedures, SPSS will yield lots of outputs, and you will have to know what are the key outputs you need to report and you need to know what they mean.
So, either get through the learning curve yourself or get some SPSS expert to help you with your homework assignment, but overall, enjoy the process and consider SPSS as a very powerful analytic tool that can help you a great deal with crunching data and getting meaningful results.
FAQ
- + Can I pay someone to do SPSS analysis?
- Send your SPSS questions by email to us, and we will send you a quote within hours. If you agree with the terms, you send the payment. We solve your problems. Results Guaranteed.
- + Who can help with SPSS?
- We can help, we have been successfully helping students with their SPSS for years.
- + How can SPSS help students?
- SPSS is a fundamental data analysis tool used by Social Sciences students, and though there are other alternatives, SPSS is one of the advanced ones that offers simple an intuitive GUI.
- + What is the best website for help with SPSS homework
- We think we are! ;-) We have been helping students with SPSS for almost 20 years.
- + How do I write an assignment in SPSS?
- It depends on the type of assignment. Usually you start with descriptive statistics of the data, acting as a pre-screening process, and after you assess that the data are well suited, you can conduct inferential analysis and draw statistical conclusions.
- + Are people still using SPSS?
- Yes! SPSS is extensively used and nothing indicates that will change in the near future.
- + Is it hard to work with SPSS?
- All software package have a learning curve, and SPSS is not the exception. Added to this is the fact that you need to have a solid statistical knowledge to get the best out of the software and interpret the outputs it renders.
Submit your problems for a free quote and we will be back shortly (a couple of hours max). It costs you NOTHING to find out how much it would cost to solve your problems.
Our team is highly experienced in SPSS, Minitab, EXCEL and the majority of the statistical software packages out there. Request your free quote. We a have a satisfaction guarantee policy. If you're not satisfied, we'll refund you. Please see our terms of service for more information about the satisfaction guaranteed policy. See also a sample of our work.
Why we can help with your Stats?
Experience
We have successfully help customers online for more than 10 years now
Statistics Expertise
We can do handle any type of statistics analyis/homework/questions. Our tutors have real expertise, and big majaority of our customers are returning customers
Step-by-Step Solutions
We provide detailed, step-by-step solutions, and we strive to provide exactly what our customers want.
Free Quote
E-mail us your problems, we will review them and promptly come back to you with a free quote
Very Competitive Prices
We strive to provide the best possible prices for our services
We take pride of our work
Our tutors take pride on the work we do. We diligenty do work for our customers, and put great attention to details striving to always provide a great final product
